

Overfitting and Underfitting with Learning Curves
An introduction to two fundamental concepts in machine learning through the lens of learning curves.
Think about school, a teacher, and a set of questions you must study for every exam.
At the end of the year, the teacher publishes a chart showing the number of mistakes students made as it relates to how much time they had to prepare for the test:
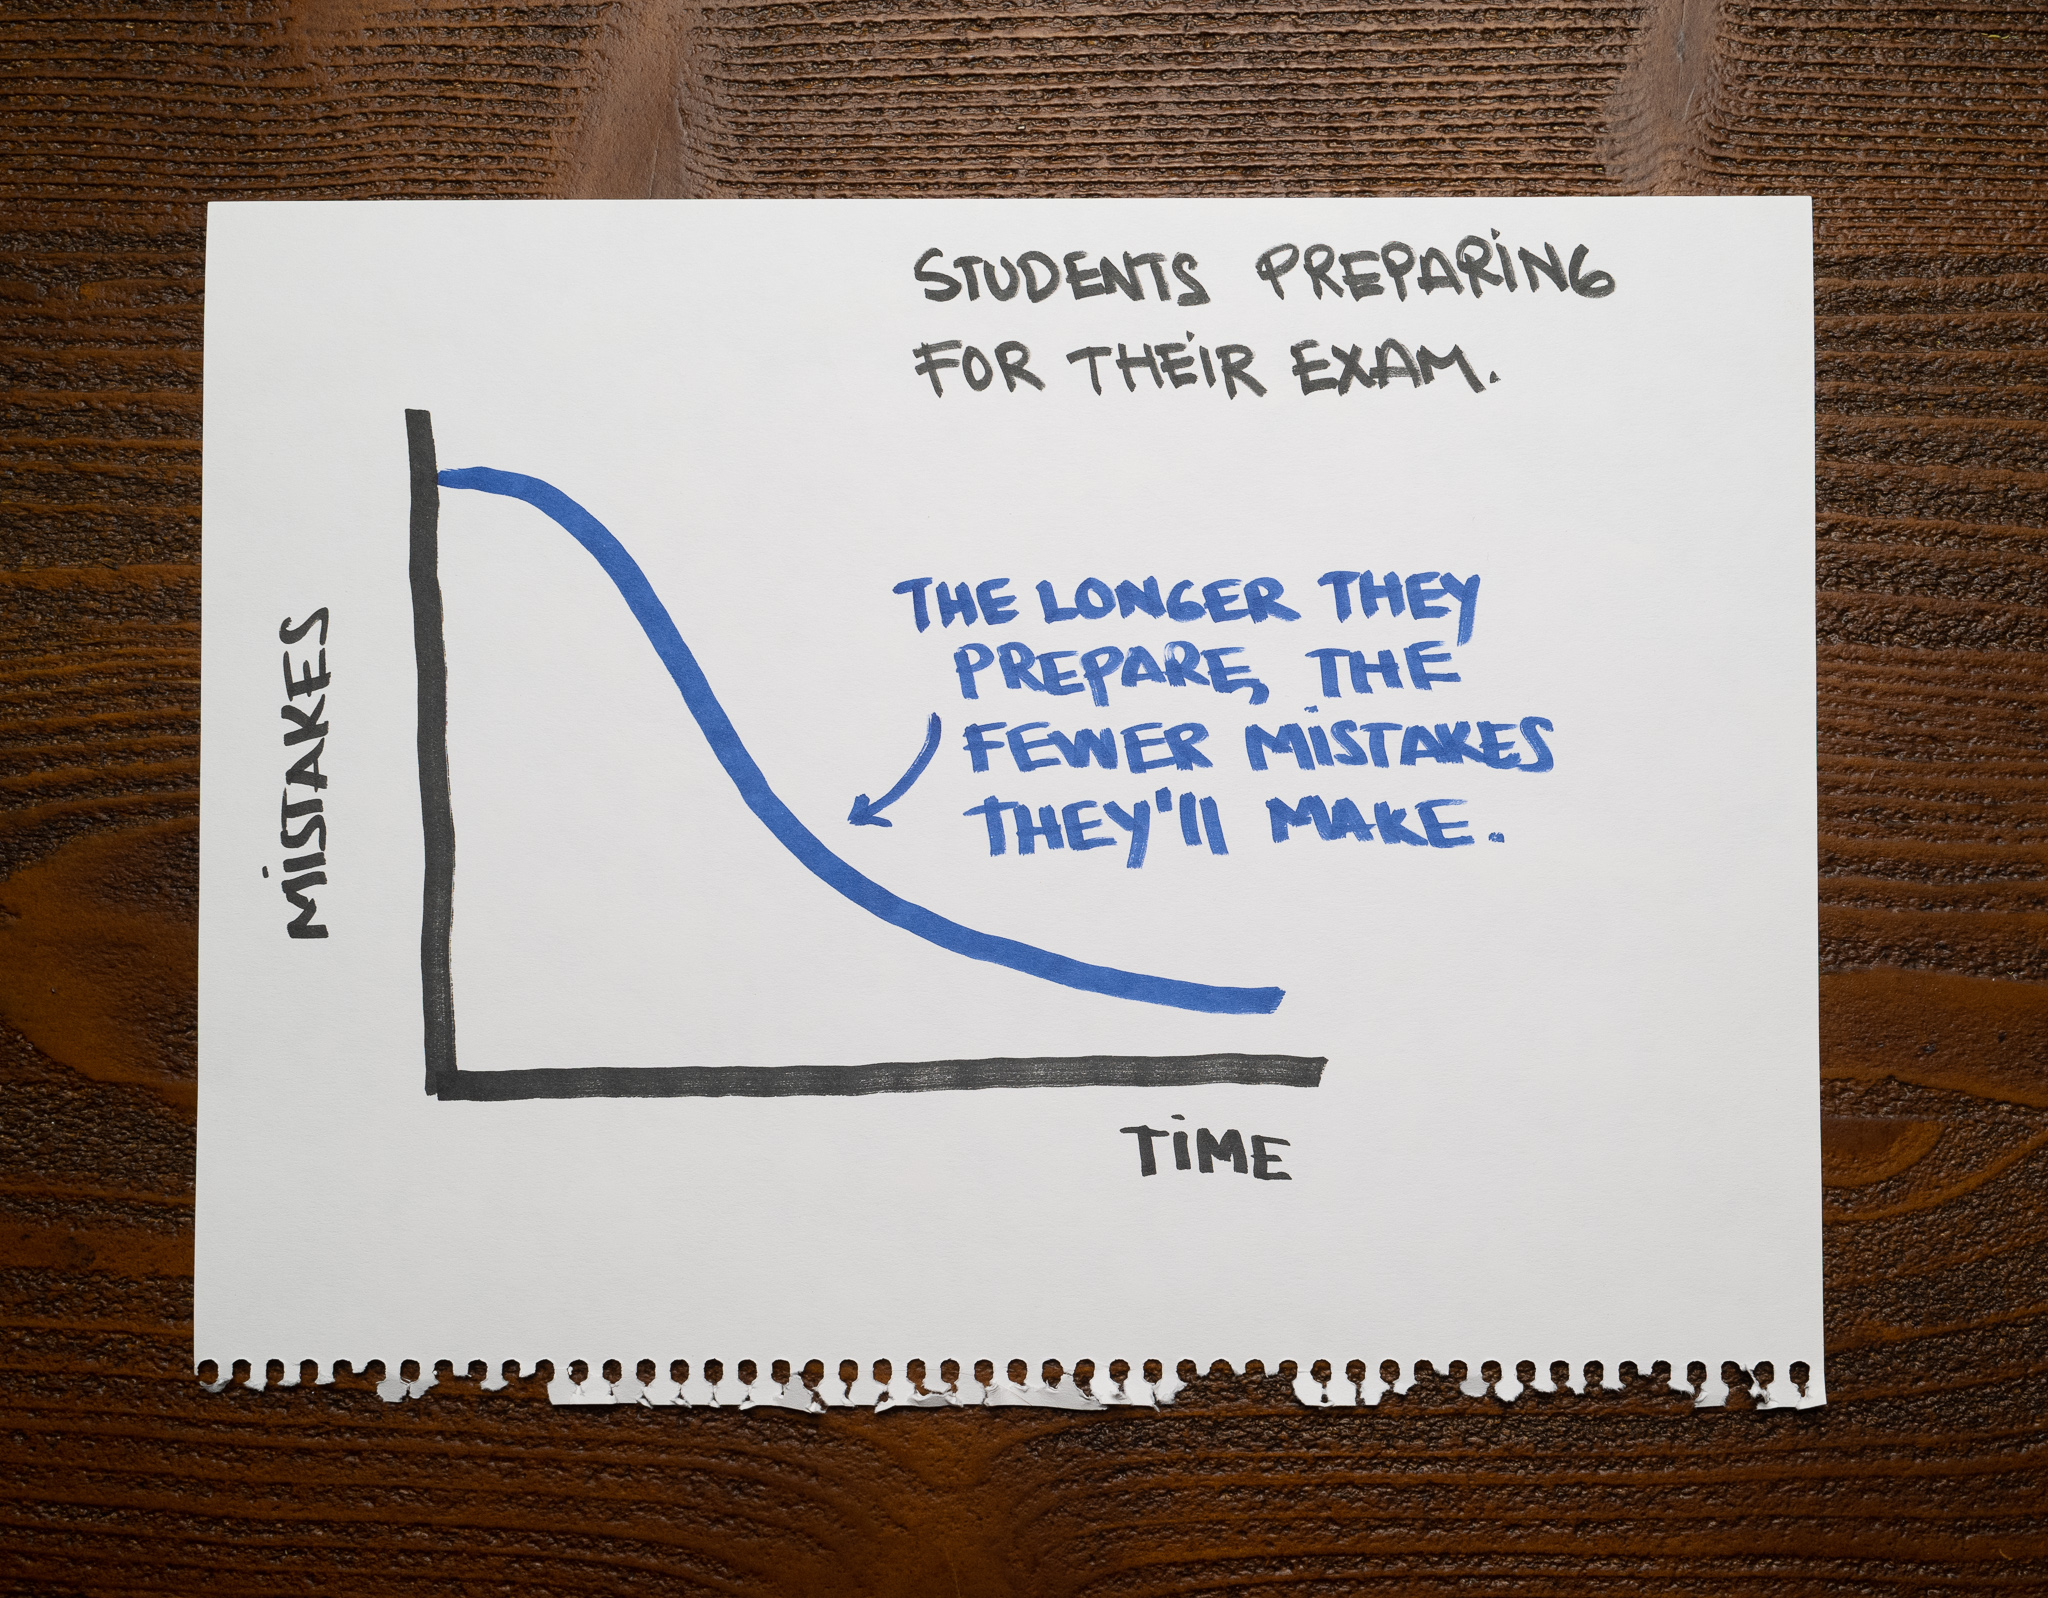
The longer students prepared, the fewer mistakes they made. That makes sense.
Every teacher wants their students to learn the material. They don't want them to optimize for the exam; they want to build knowledge that will later generalize to situations they'll see outside the classroom.
We want the same for a machine learning model: we want it to learn and generalize what it knows to solve samples outside the training dataset. We can use a model that generalizes well to make predictions on data we haven't seen. A model that doesn't learn or can't generalize to new data is useless.
We refer to these models using two terms: when the model doesn't learn the training data, we say it's underfitting. When it starts memorizing and doesn't generalize to new data, we say it's overfitting.
Both cases are a problem, but fortunately, there are many ways to deal with underfitting and overfitting. Before we can do anything, however, we need to identify them.
Learning curves
The student's analogy helps explain some of the technical jargon in the chart below:
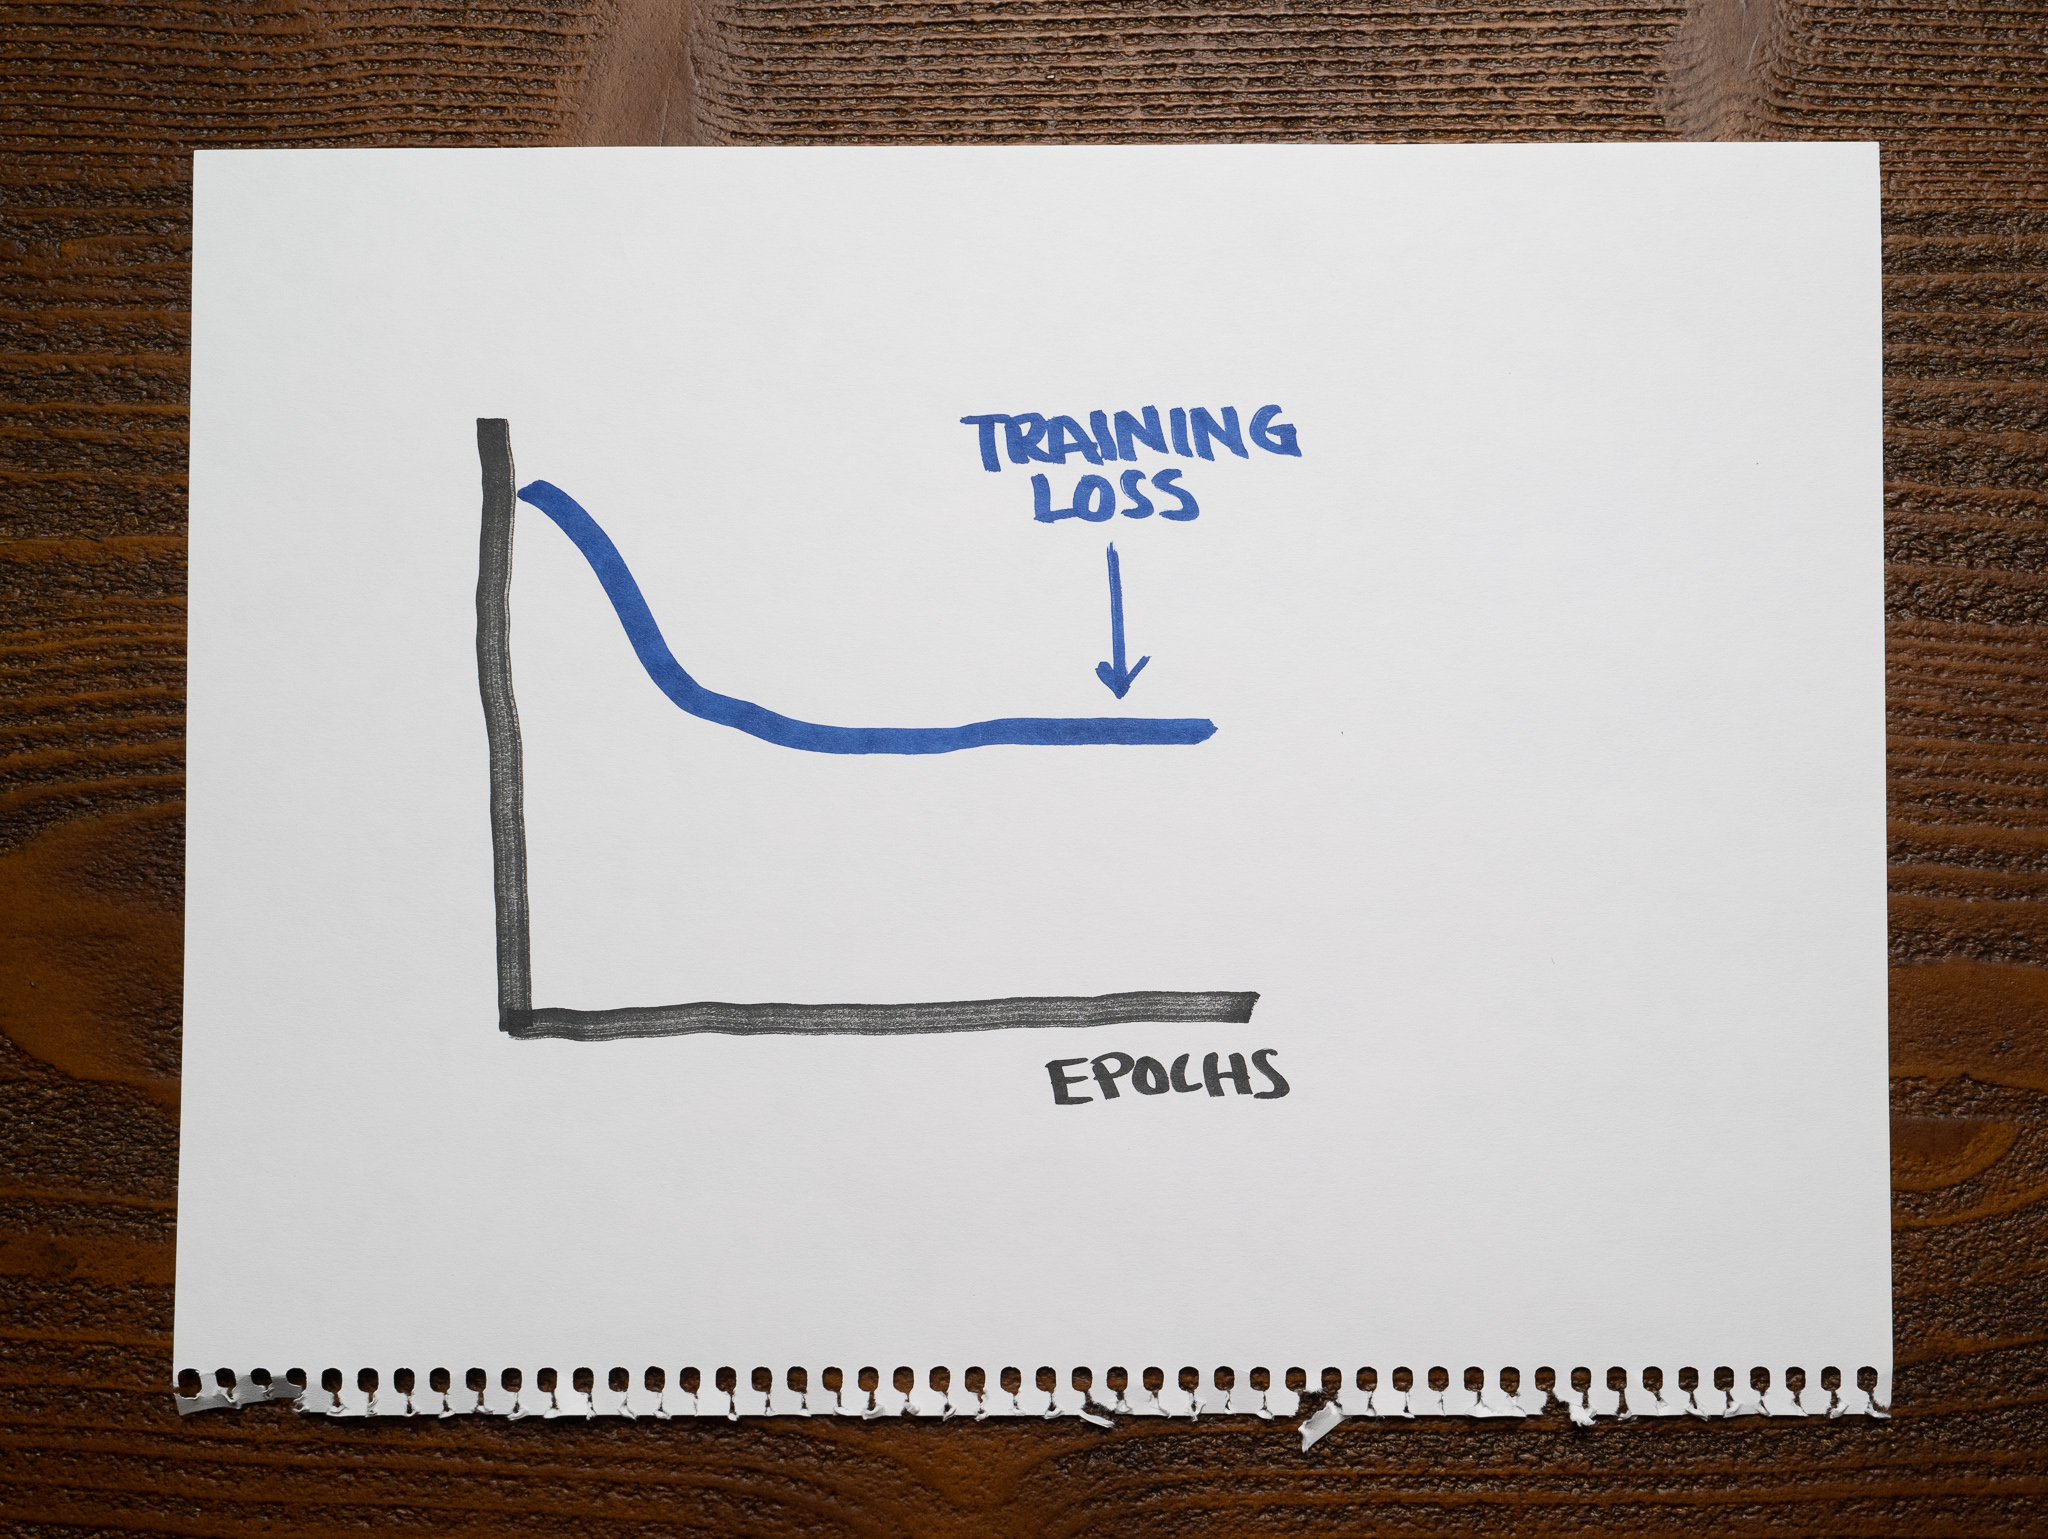
This picture shows a similar idea to our chart before. It shows how the model's training loss changes as we train it for longer.
We use the term "epochs" to represent the number of iterations we used to train the model, equivalent to the time the teacher gave the students to prepare for the exam. The model's "loss" is similar to measuring the students' mistakes. The lower the loss, the better the model.
We call these charts "learning curves." We'll use a few examples to understand when overfitting and underfitting happen when training and evaluating machine learning models.
When the training loss is high
Let's get back to the previous learning curve:
There's a crucial detail here: this is the model's loss on the training dataset. We are measuring the model's learning ability on the same data we are using to train it.
Imagine the teacher using the same questions discussed in class to evaluate students during the exam. Presumably, students could memorize the answers to these questions and ace the test. The more time they spend with the questionnaire, the fewer mistakes they will make.
If we look at the chart, such a high training loss from a model with every possible advantage to do well can only mean something must be wrong with it.
Whenever the model's training loss is too high, we say the model does not fit the data correctly. We call this "underfitting."
When the training loss is low
Here is the same learning curve, but this time you can see the training loss is significantly lower:
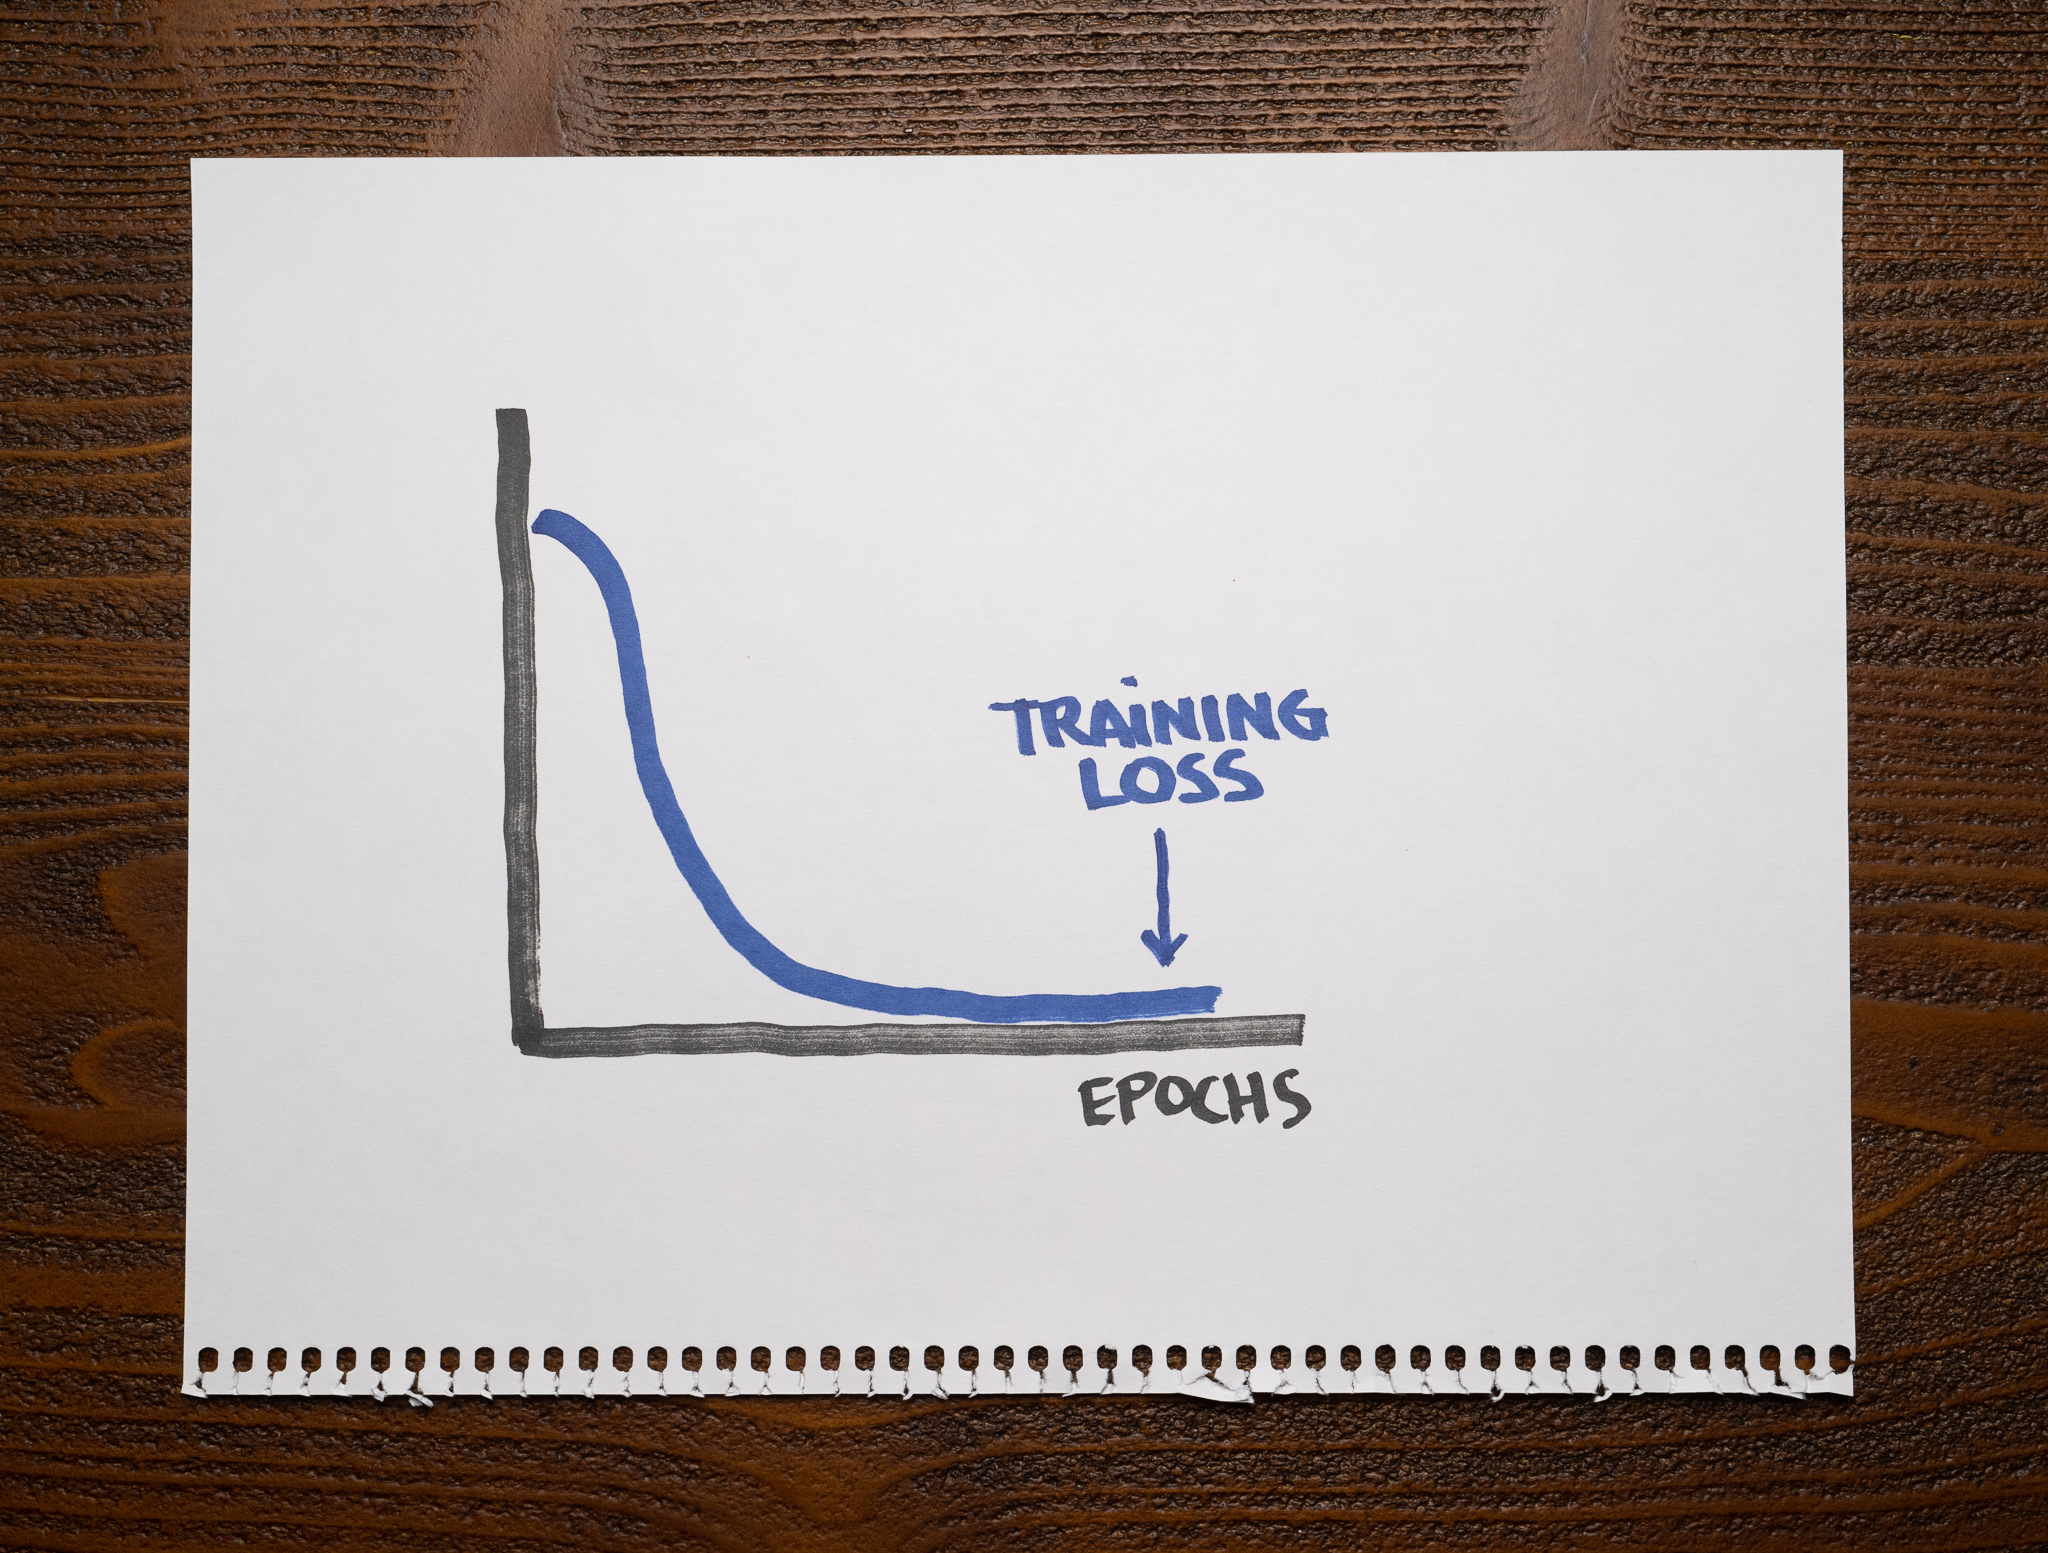
A curve like this is what we should expect from a model that fits the data appropriately, so we know it isn't underfitting. But can we say this is a good model?
If we go back to the students that answered the same questions they used while preparing for the exam, can we consider they learned the material if the exam results were good? There's a chance they just memorized every answer and didn't learn anything, so we can't make any assumptions.
This learning curve tells us the model is not underfitting, but we can't say whether it's overfitting or not. We need more information.
More learning curves
If we want to know whether the students learned the material, we need to create an exam with questions that differ from those they already saw.
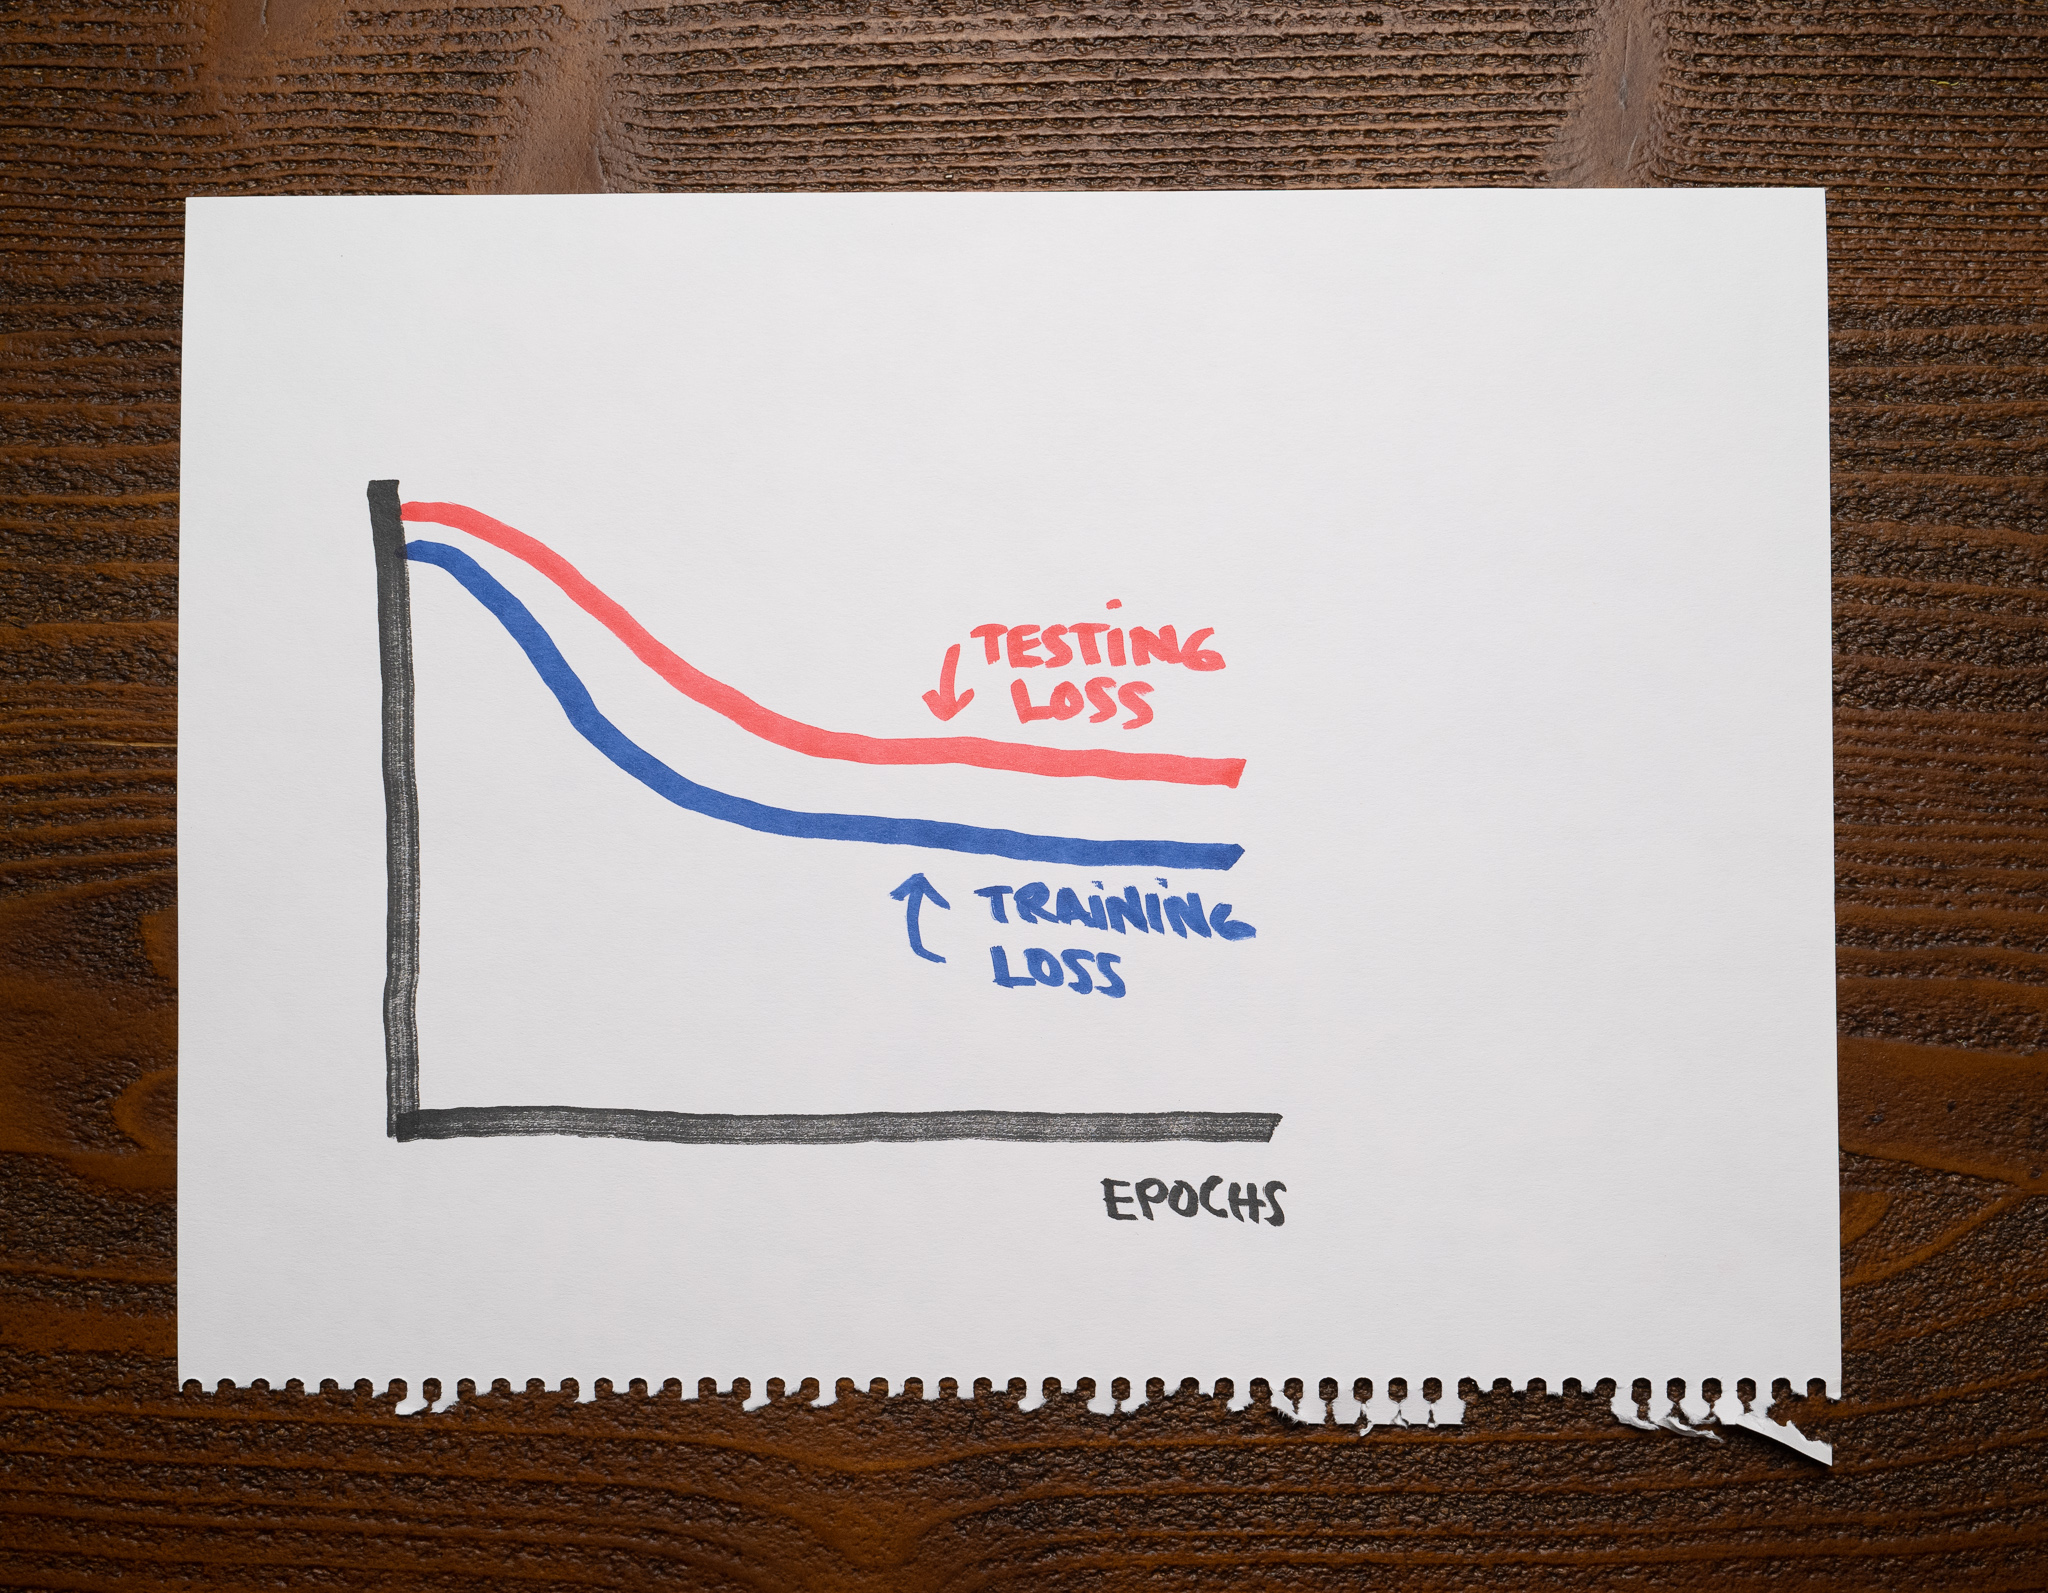
We use the same idea when training machine learning models: a training set to teach the model and a separate set to evaluate it. We can now plot two learning curves; the training loss as we did before and a new testing loss:
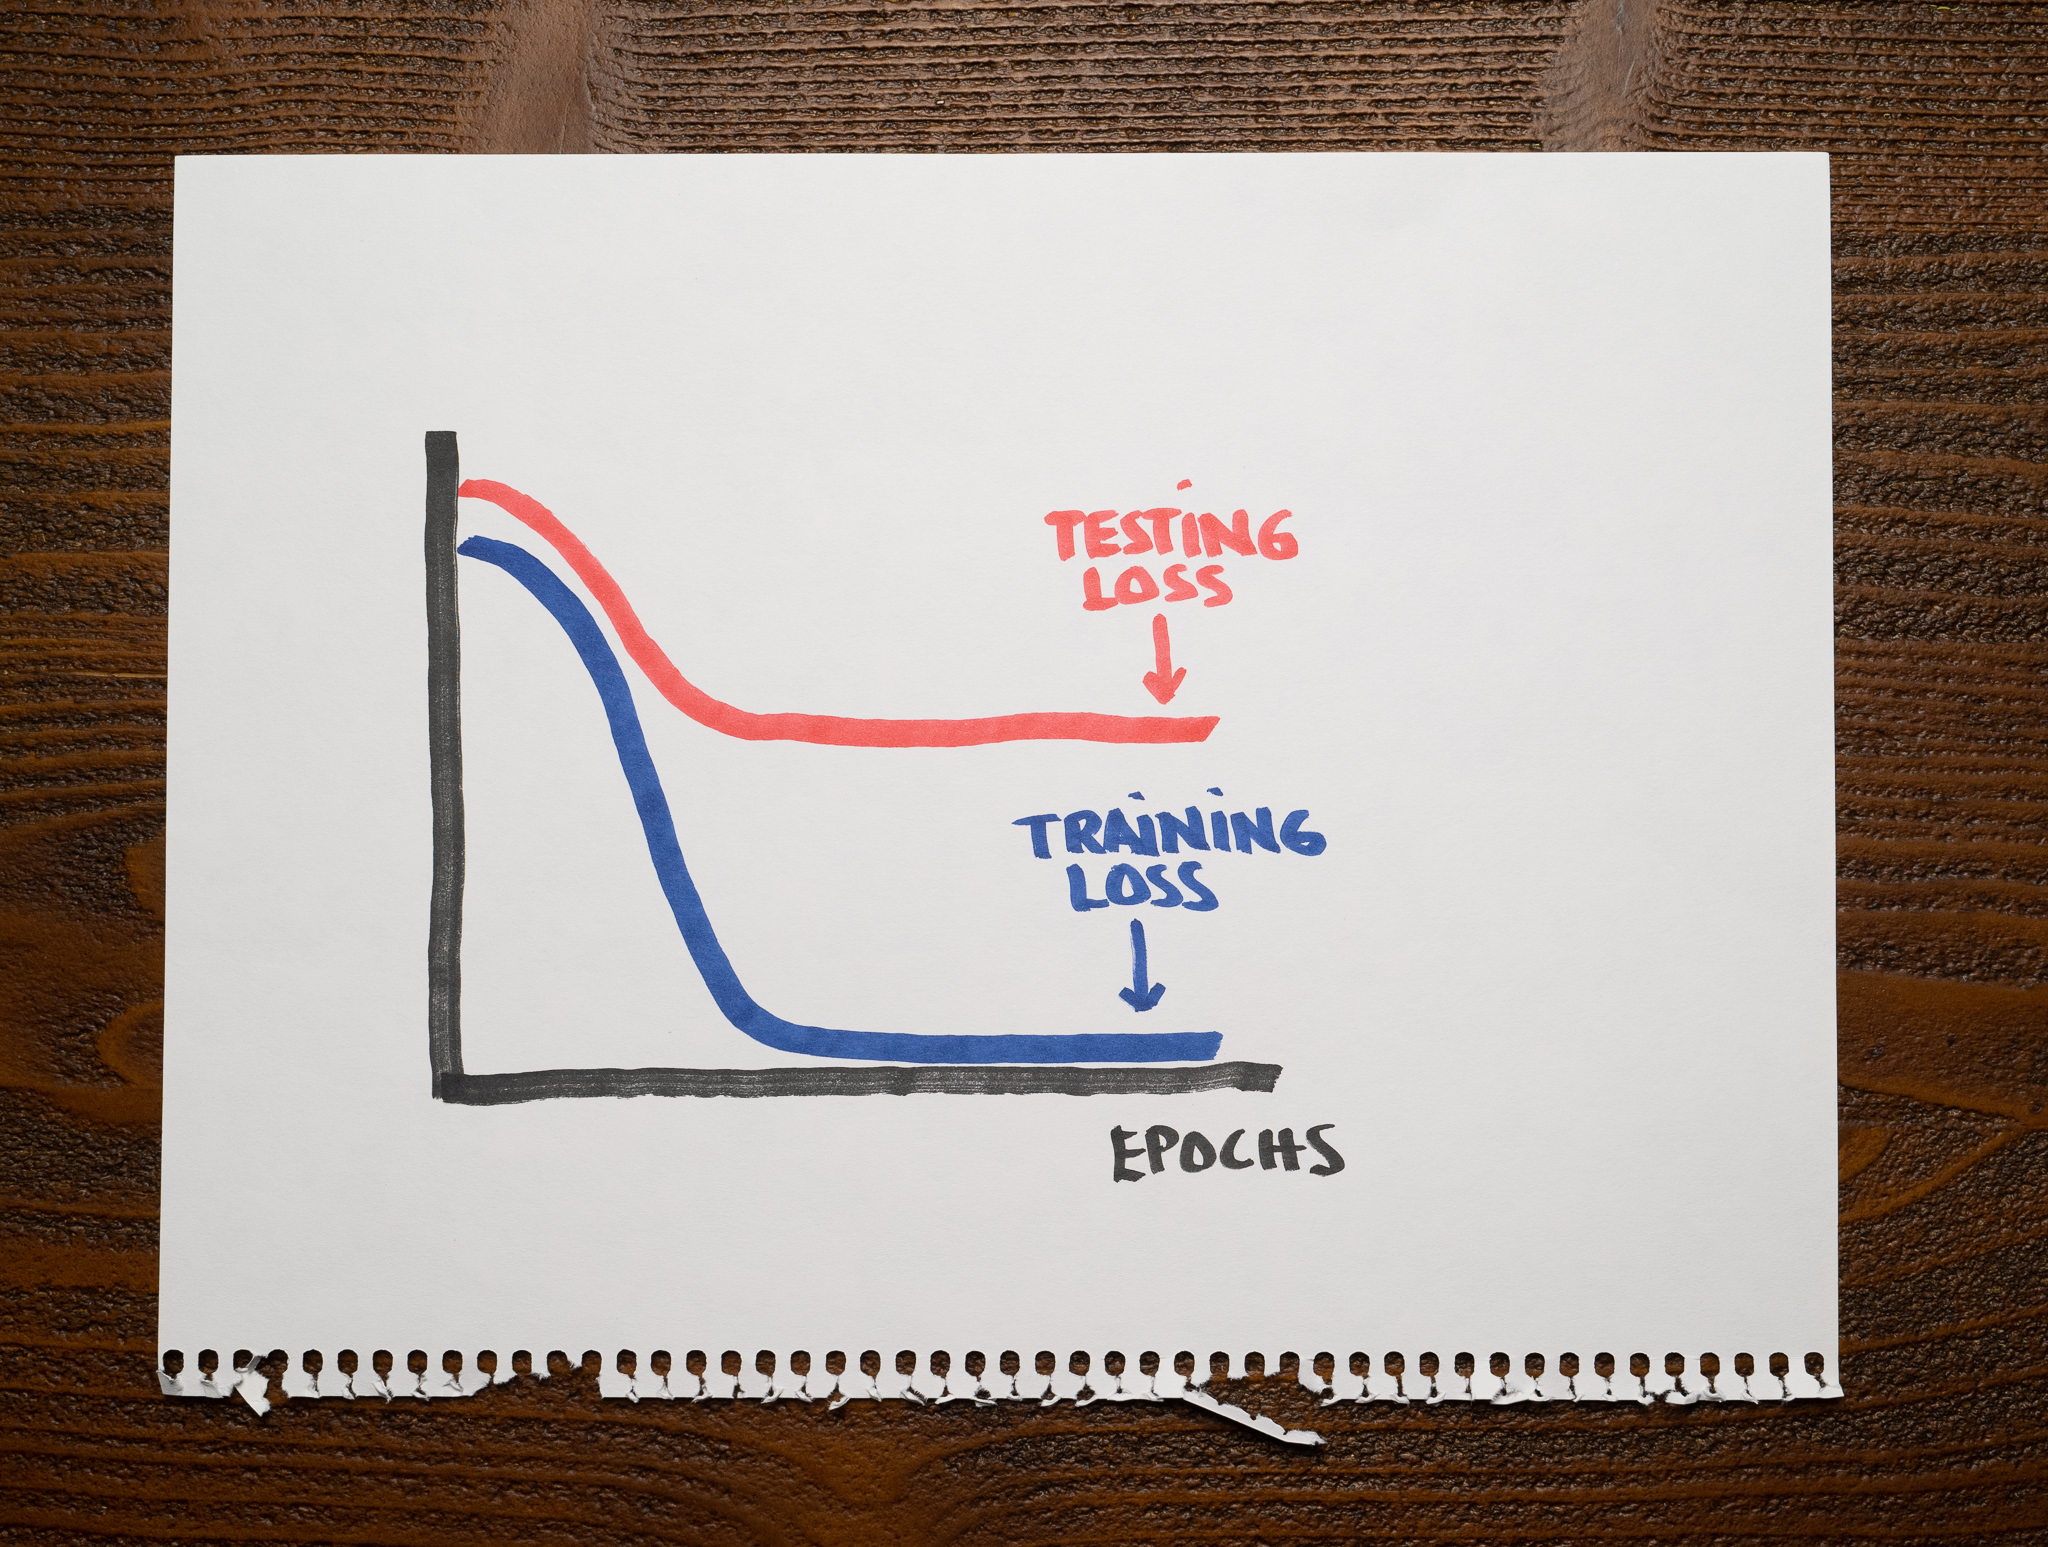
While the training loss alone was not enough to decide whether the model was overfitting, the testing loss makes it clear. The model's loss might be good on the training dataset, but it suffers when we evaluate it on the testing set. Think of the students that crushed the exam when they knew the questions beforehand but didn't score well when there were new questions.
Whenever this happens, we say the model fits the data too well and doesn't generalize to unseen data. The name we use for this is "overfitting."
When both losses are high
Remember that a high training loss indicates that our model is underfitting. Take a look at this chart:
The testing loss curve is further proof our model isn't doing well. The model can't cope with the training data, much less with the testing data. If the students can't perform well on an exam they know the questions beforehand, they will undoubtedly do poorly on one for which they don't know the answers.
An underfitting model will have high training and testing losses.
When both losses are low
Here is what we'd like to see when we plot our learning curves:

The low training loss suggests the model learns the training data well. At the same time, the low testing loss indicates the model generalizes correctly and works well on unseen data.
A well-fit model doesn't underfit or overfit. The learning curves of a good model will show both the training and testing losses continuously decreasing to a low value.
When there's a gap between losses
These losses show promise:
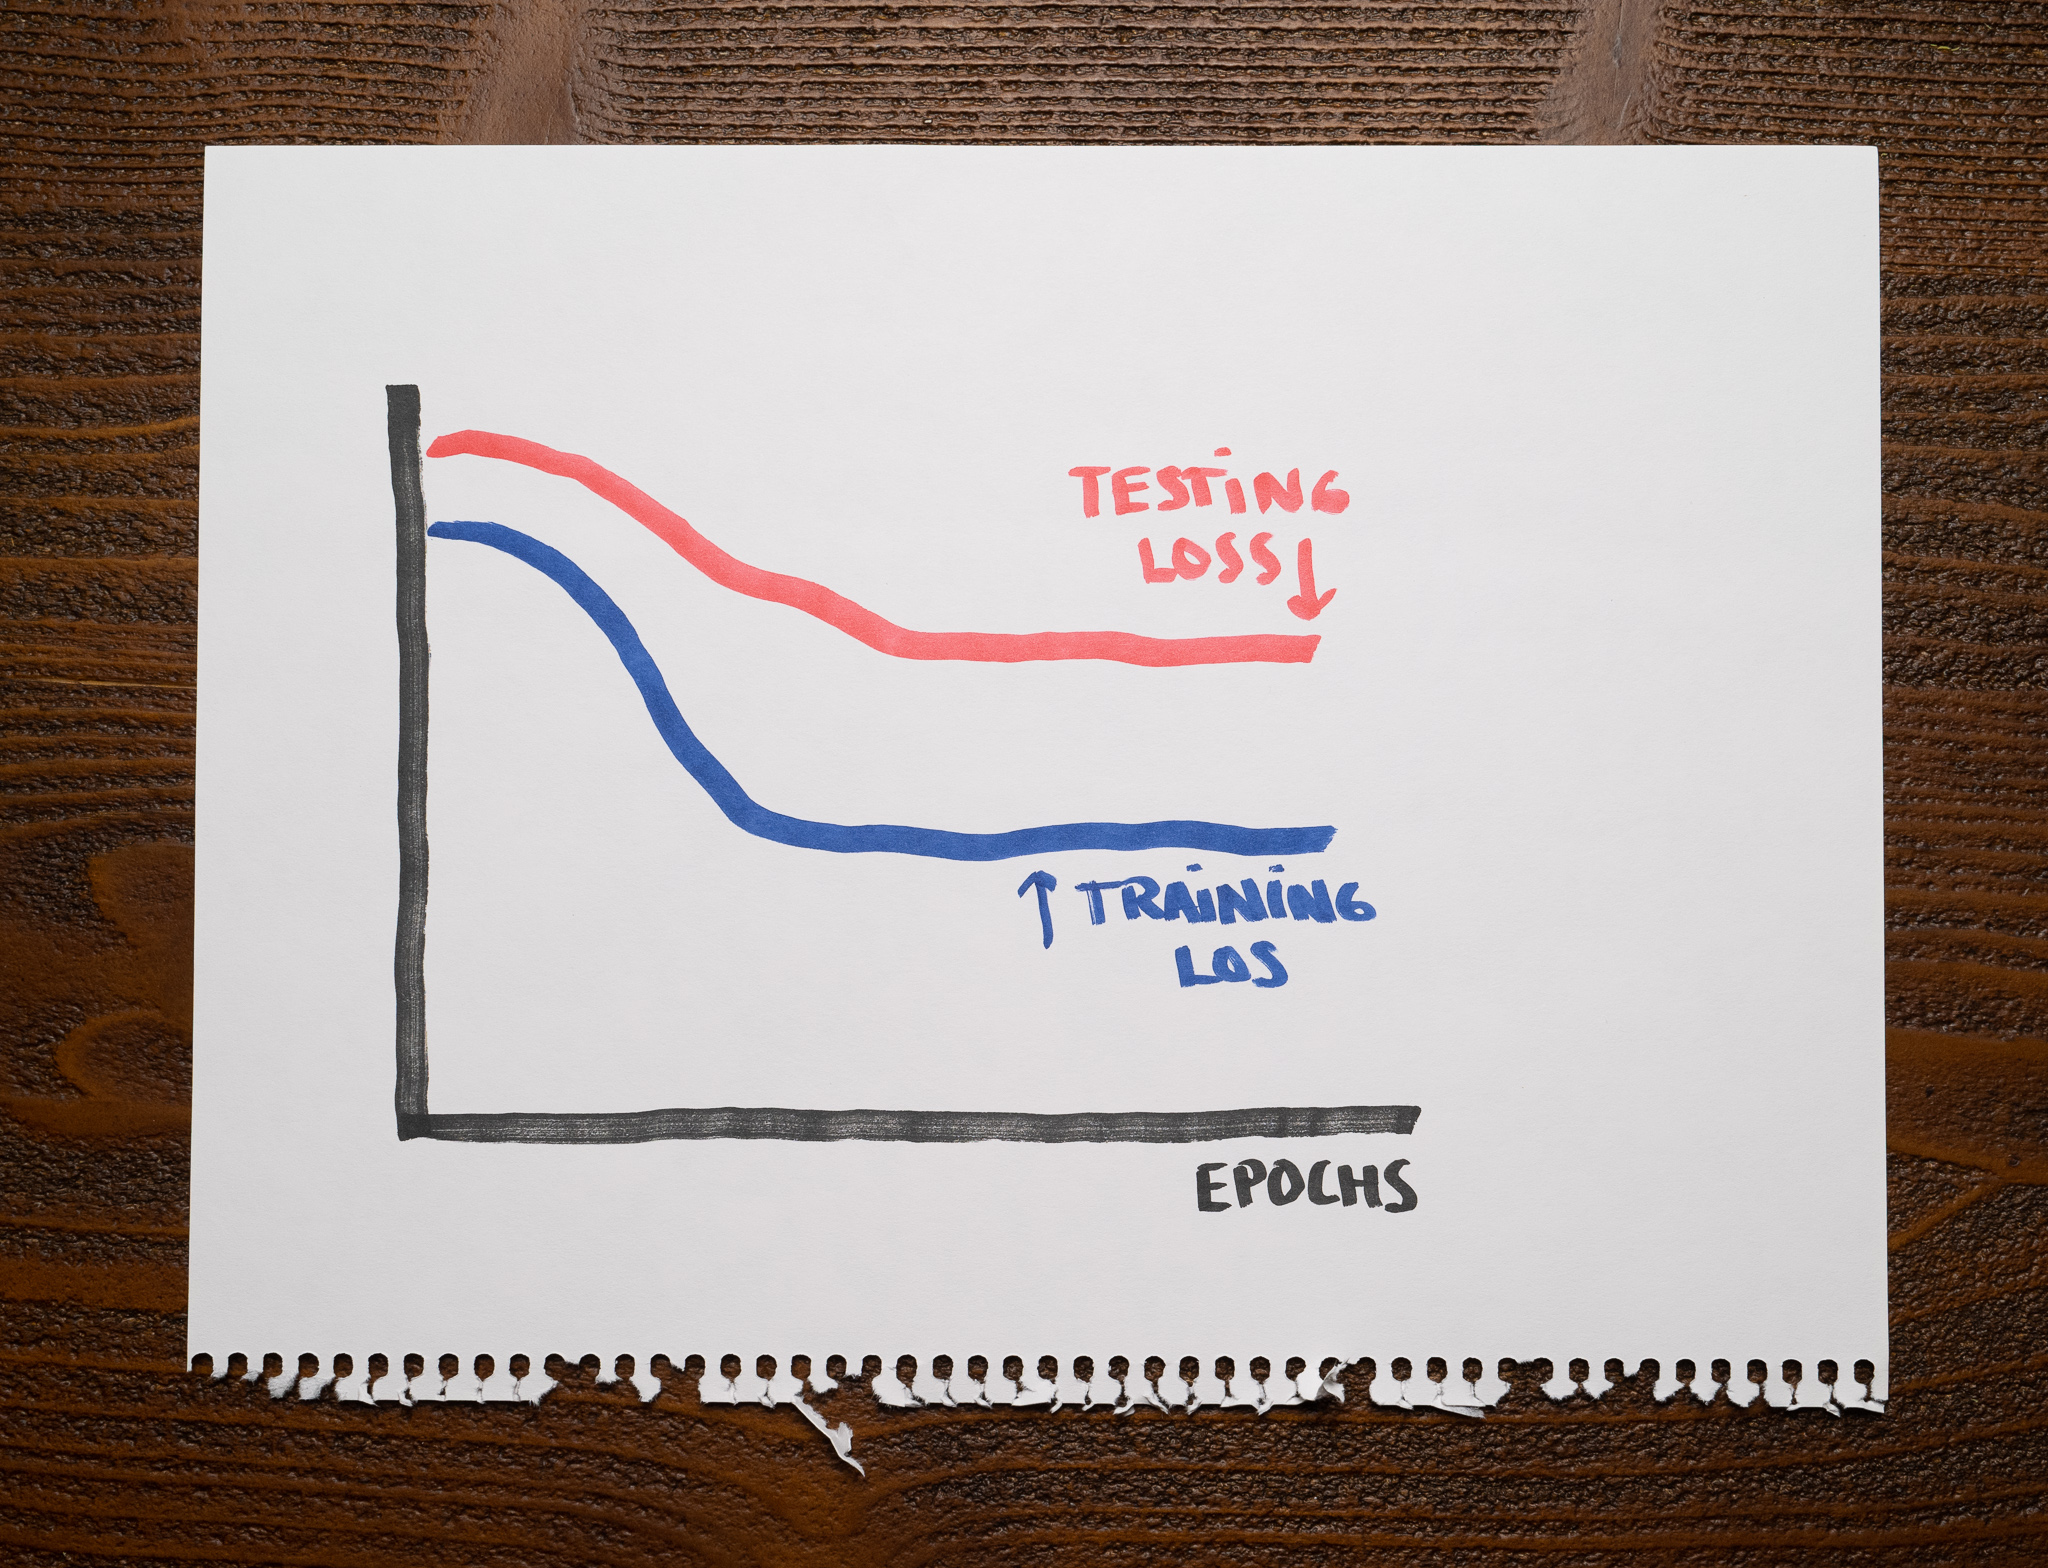
They both start decreasing, but there's a significant gap between them.
This situation happens whenever the training dataset is insufficient for the model to generalize appropriately and perform well on the testing set. For example, the training and the testing data might differ significantly, or the training dataset might not be large enough.
Whenever this happens, understand you have a lot of opportunities to improve the model. You want that gap to be small.
When the testing loss suddenly increases
The following chart shows a common scenario when training a model:
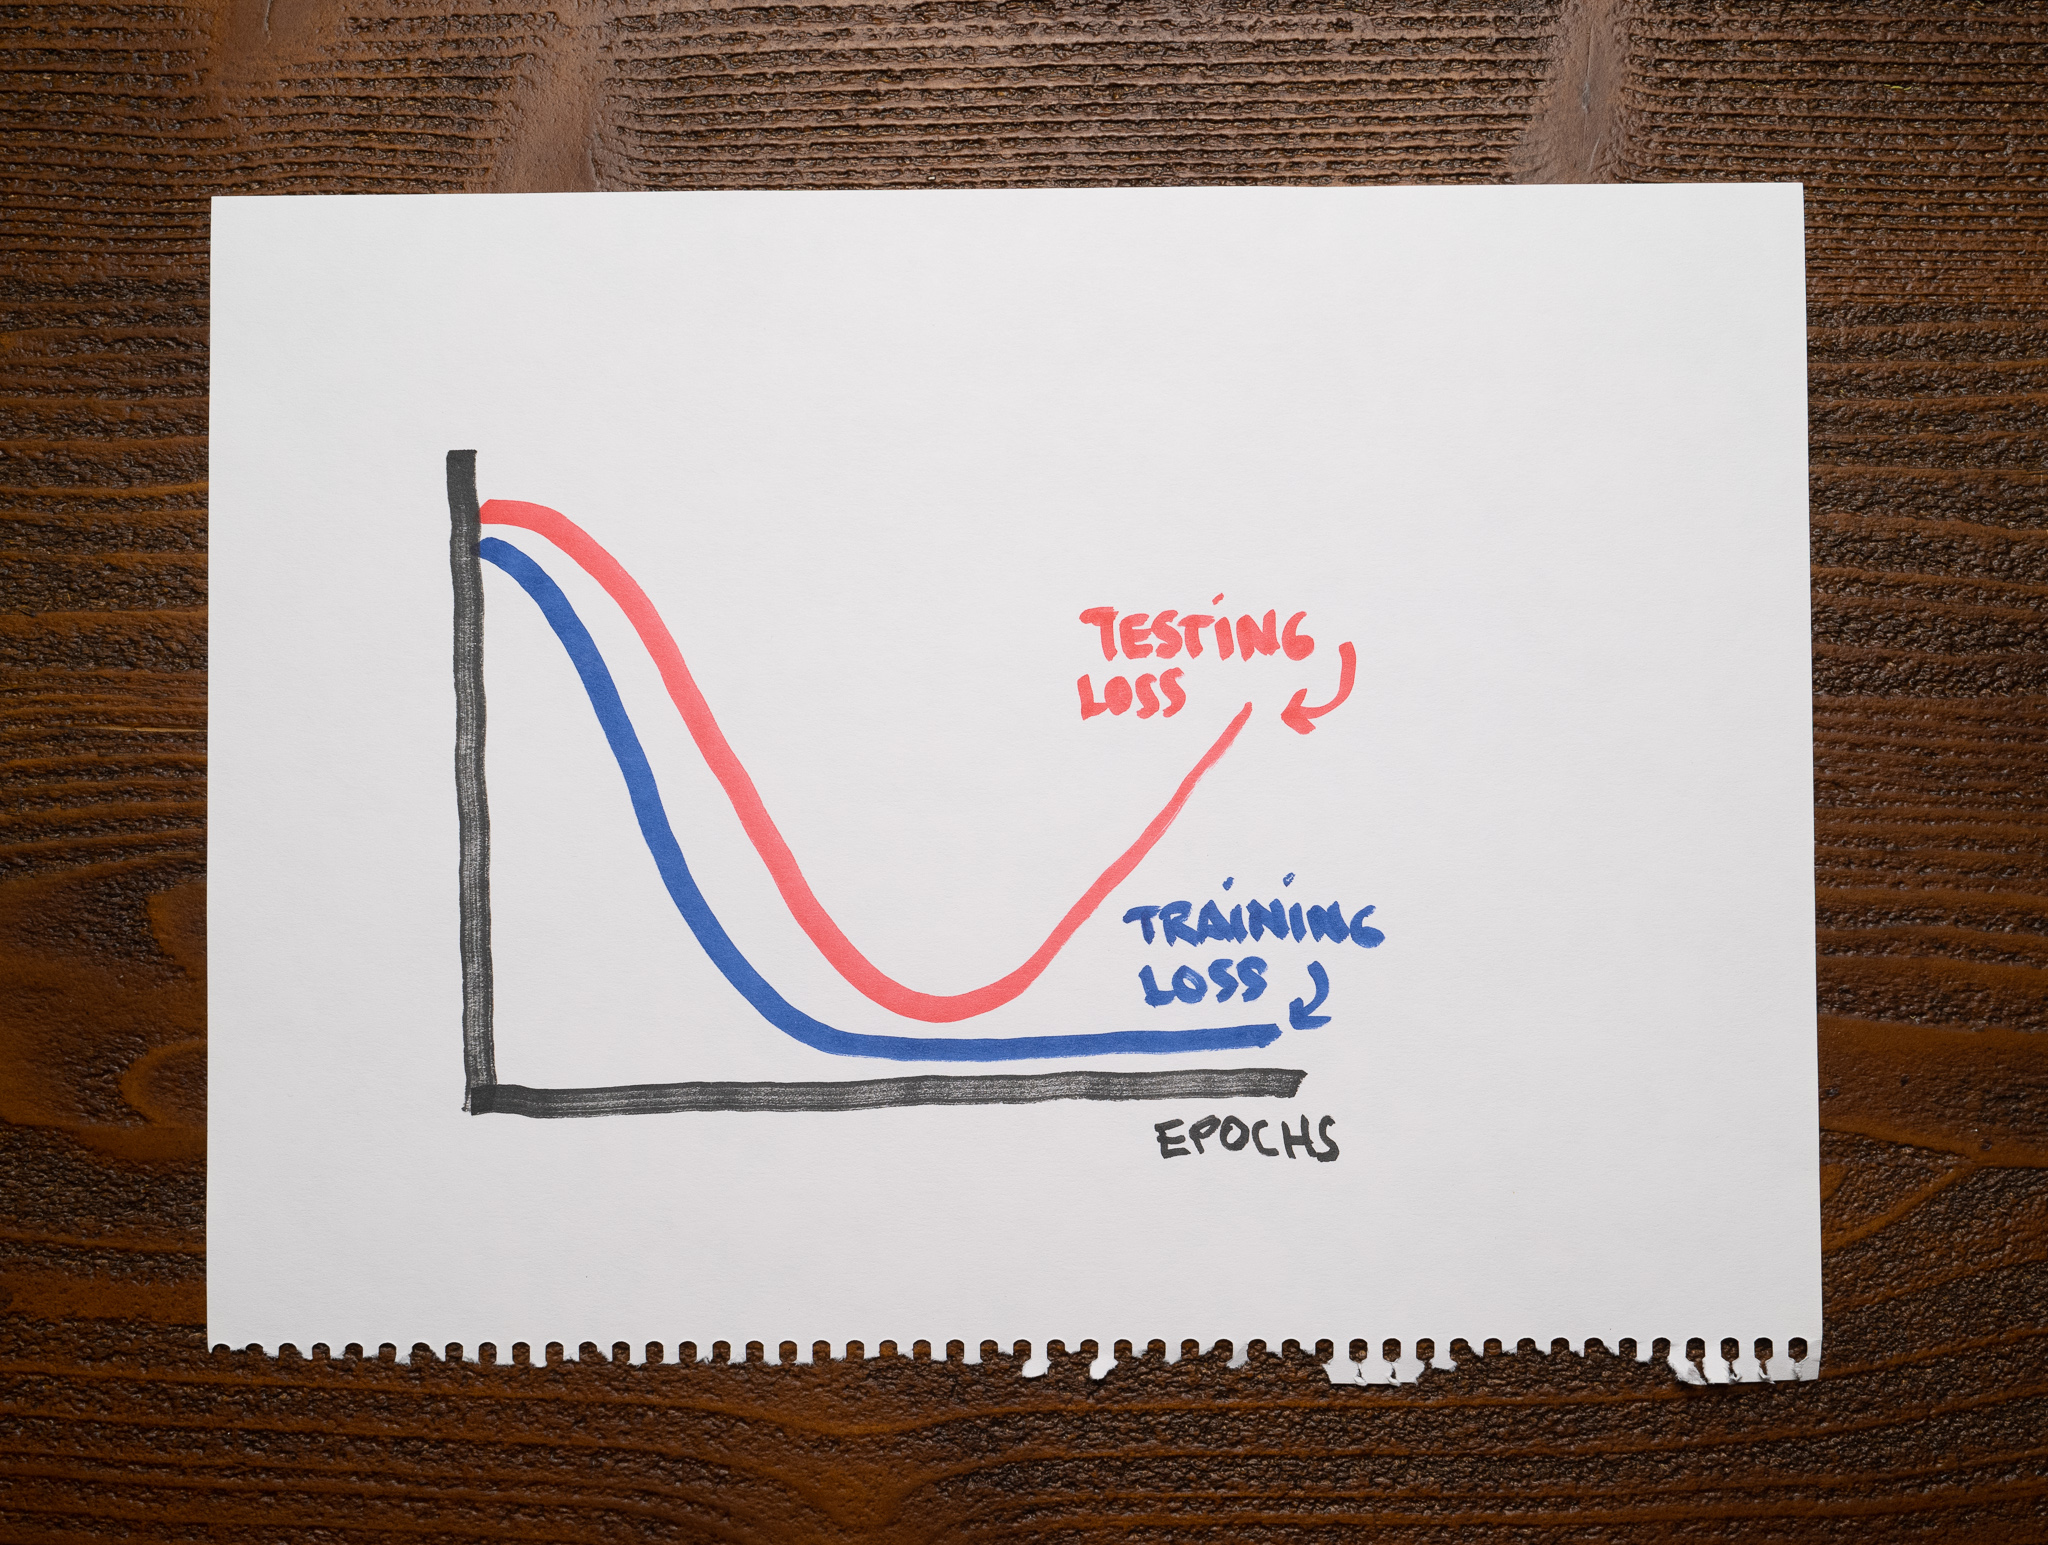
Notice how the training and testing losses decrease appropriately until a point when the testing loss starts increasing. The training loss continues improving at that moment, but the testing loss diverges significantly.
We already know that a model with low training and high testing loss is overfitting. We can apply the same idea to this chart and conclude that up to the point where the testing loss reverses course, we had a well-fit model, but from then on out, the model overfits. Early stopping is a popular technique to prevent this from ruining your model.
Summary
We use learning curves to diagnose a machine learning model during training and evaluation. This article focused on learning curves that show the model's loss, but we can use other metrics with a similar purpose.
Learning curves are a great tool to help us determine whether a model is overfitting or underfitting:
- An overfitting model performs well on the training data but doesn't generalize to testing data.
- An underfitting model performs poorly on training and testing data.
Understanding how to interpret learning curves is crucial for every machine learning practitioner.
Latest articles
- The wrong batch size is all it takes. How different batch sizes influence the training process of neural networks using gradient descent.
- When accuracy doesn't help. An introduction to precision, recall, and f1-score metrics to measure a machine learning model's performance.
- Confusion Matrix. One of the simplest and most popular tools to analyze the performance of a classification model.