

Confusion Matrix
One of the simplest and most popular tools to analyze the performance of a classification model.
Most people summarize the performance of a classification model using a single high-level metric like accuracy or f1-score. While helpful, this doesn't give us enough information about the quality of the predictions and the mistakes the model makes.
The confusion matrix is a way to take a deeper look into the performance of a classification model.
A single metric is not enough What conclusions can you draw from a multi-class classification model that predicts four classes with 80% accuracy? Unfortunately, while we know that the model correctly predicts four out of five samples, we can't say anything about the performance of specific classes or the mistakes the model makes.
For example, the model could predict one particular class exceptionally well and make most of its mistakes in another category. Understanding this information is critical to improving the model, so we often must move past a single-metric performance evaluation.
The confusion matrix
A confusion matrix is a table that helps analyze the performance of a classification model. It breaks down each class and the number of correct and incorrect predictions the model makes. It gives us immediate access to the model's errors and their type.
We need to evaluate a classification model to fill up a confusion matrix. Let's imagine a hypothetical scenario where we build a binary classification model:
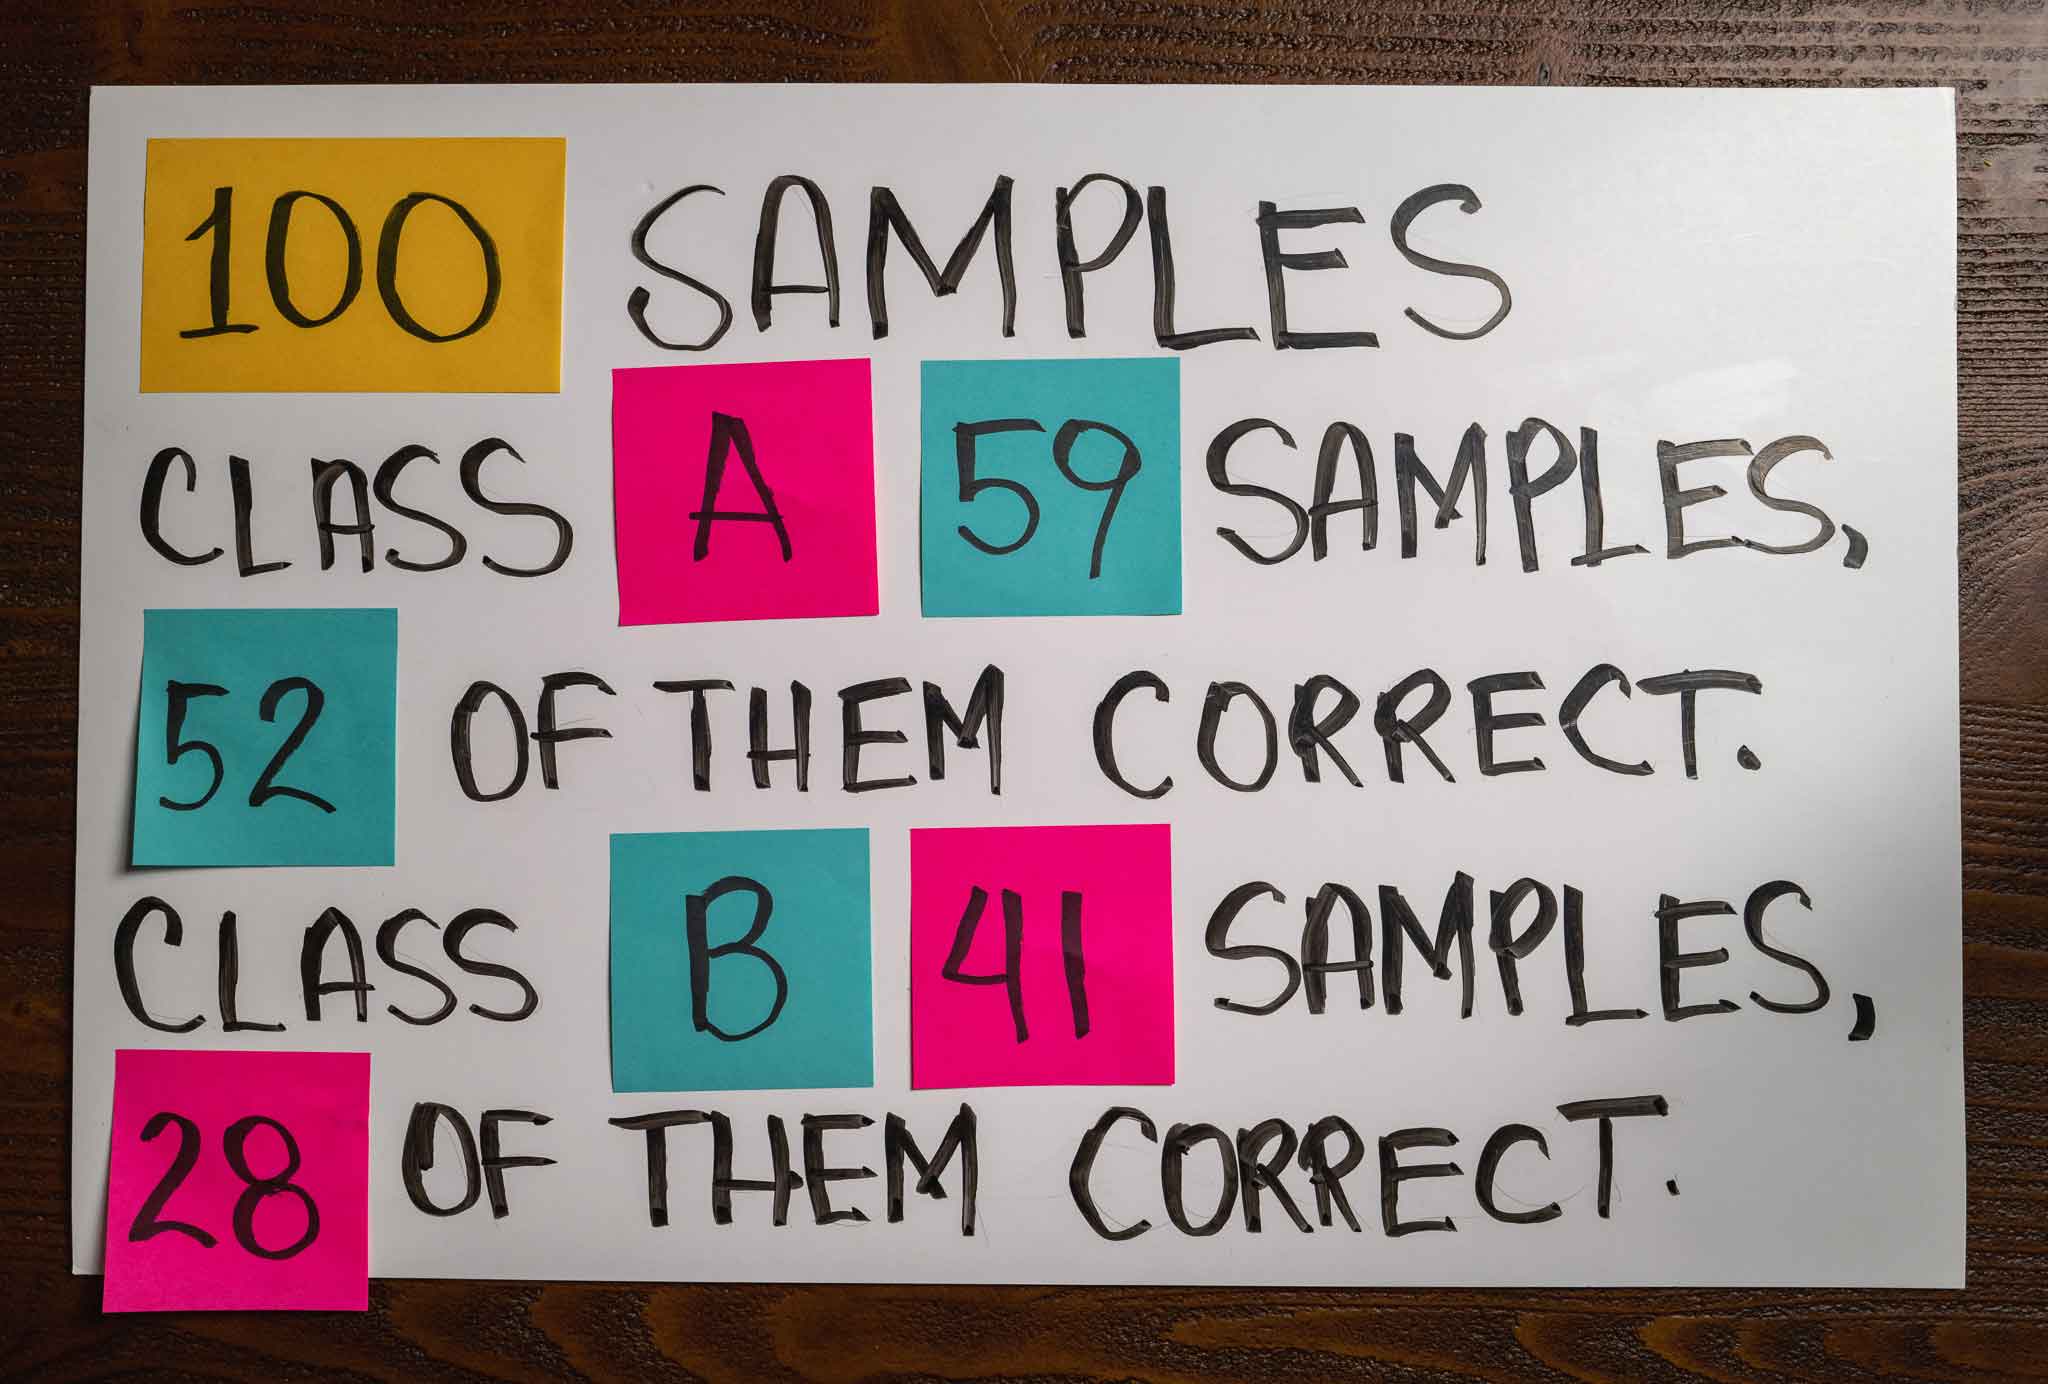
We have 100 samples, 59 belonging to class A and 41 to class B. After running the model, we get 52 out of 59 class A predictions correct and 28 out of 41 class B predictions correct. This information is enough to create a straightforward confusion matrix with the results:
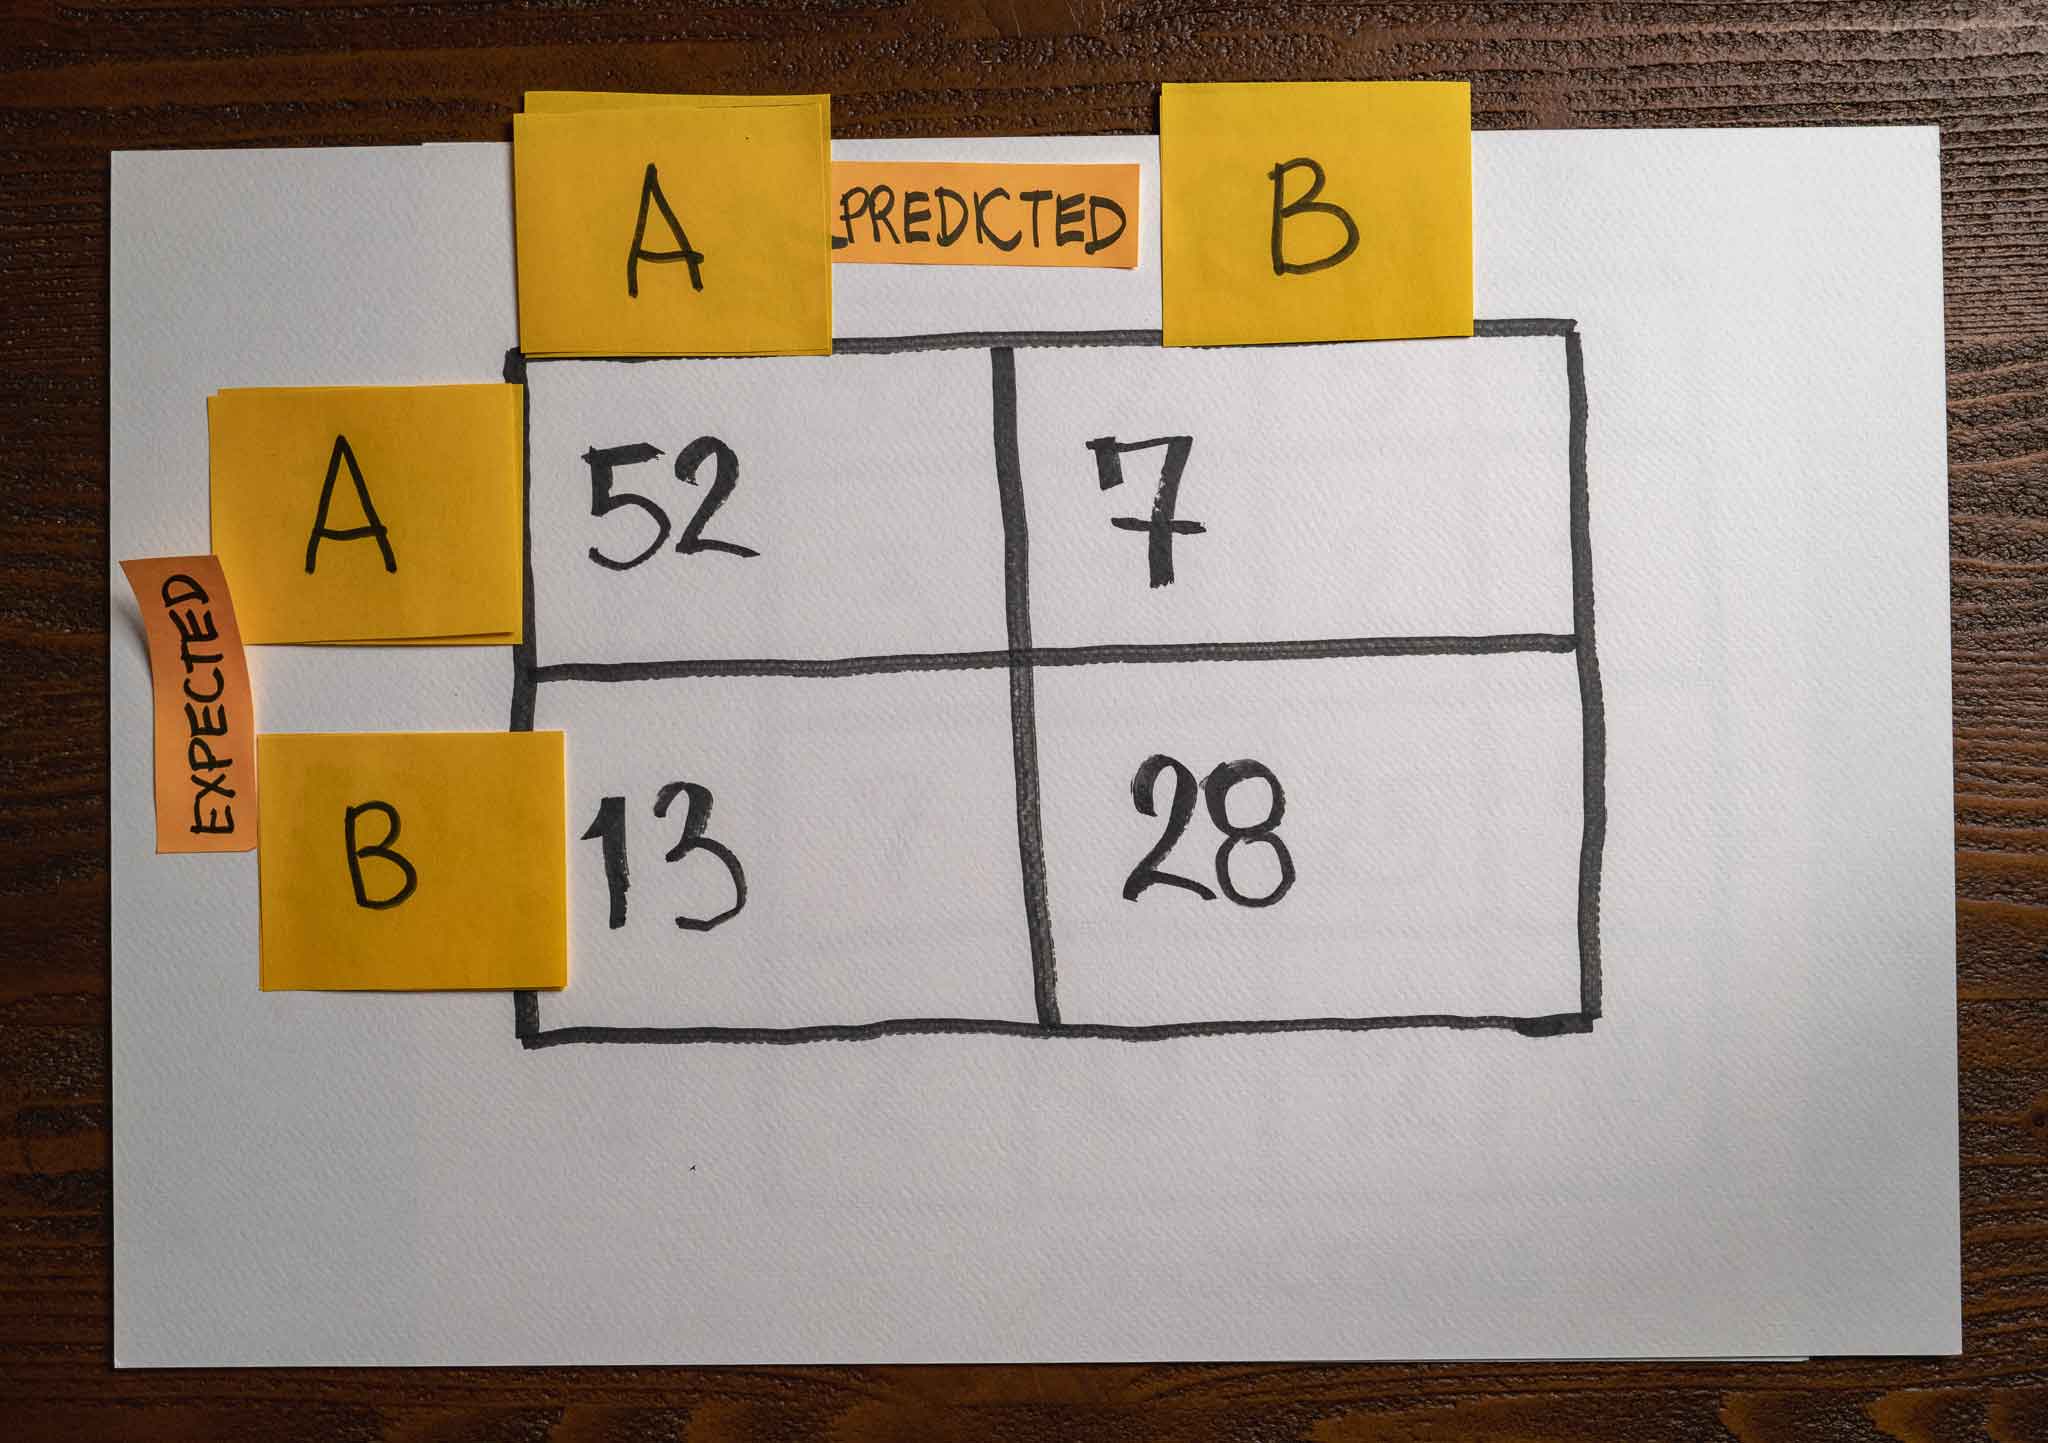
The model correctly predicted 52 samples from class A and made a mistake with the other seven samples. It also correctly predicted 28 samples from class B and made 13 mistakes.
The intersection between a row and a column gives us the number of predictions between those two classes. In this example, I use the rows of the matrix to talk about expected values while I use the columns to talk about the predicted values. Many opt to display the model's predictions horizontally and the actual values vertically, but that doesn't affect the main idea.
Positive and negative outcomes
A common problem that binary classification models solve is identifying specific instances from normal ones. For example, identifying spam from regular emails or fraudulent transactions from legitimate ones. We commonly refer to these two cases as positive and negative, where a positive sample is an outcome we want to identify.
We can use a confusion matrix to represent the predictions of a model, but this time, let's extend it with more information:

Notice how simple it is to determine the number of True Positives (TP,) True Negatives (TN,) False Positives (FN,) and False Negatives from the confusion matrix. This information is critical to computing metrics like accuracy, precision, recall, and f1-score, among others.
Extending it to more classes
We can extend a confusion matrix to more than two classes. Here is an example with four classes:
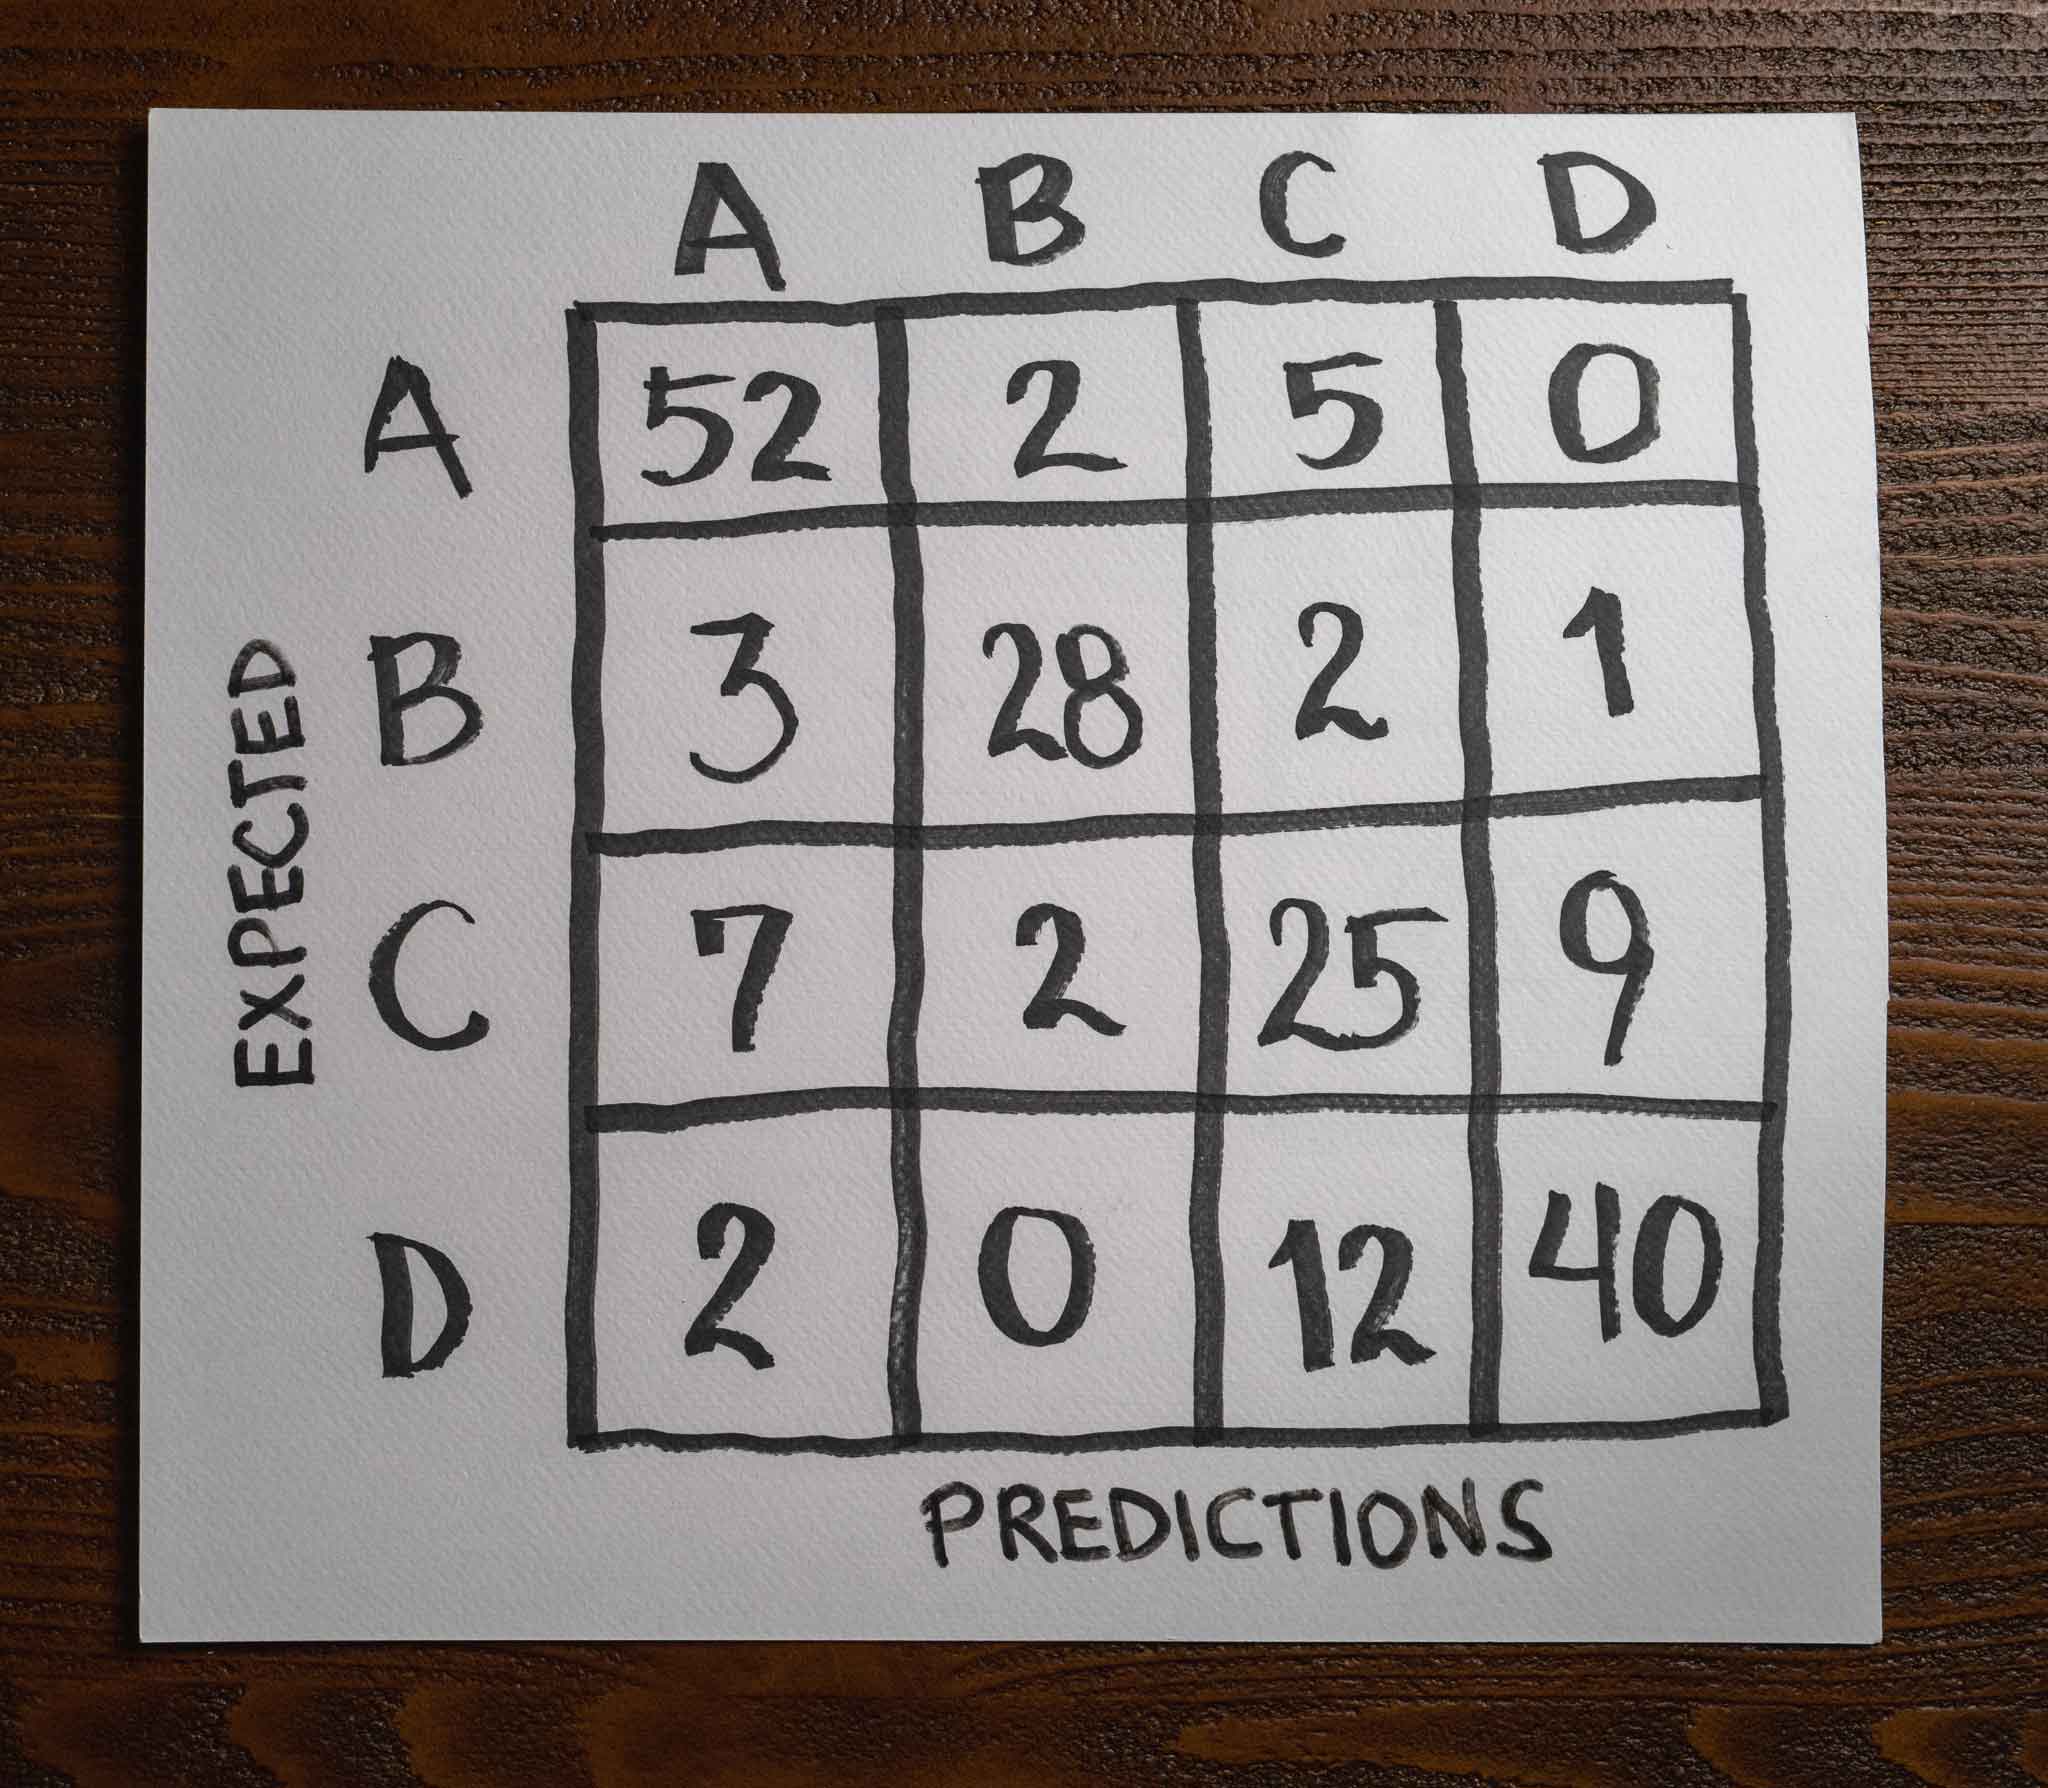
Like before, we can determine the model's mistakes by looking at the different combinations in the matrix. For example, the model predicts 12 samples that belong to class D as class C but never makes that mistake with class B. It has problems telling class C and D apart, with 19 total errors. Class C is the worst performing class with 18 mistakes, while class B is the best with only six mistakes.
Notice how a confusion matrix for multiple classes works just like the one for a binary classification problem.
But why would you care?
A confusion matrix is a visualization tool that surfaces essential information that otherwise would be hard to see. And because it's very effective at doing that, many people use it.
Understanding how it works and using it to communicate the results of your model will allow you to talk to other people, understand their work, and share yours.
But even more important than that, the information that a confusion matrix puts right in front of us, it's critical to decide the best strategy to improve that model. It makes painfully clear where the problems are and where our time should go.
Latest articles
- The wrong batch size is all it takes. How different batch sizes influence the training process of neural networks using gradient descent.
- Overfitting and Underfitting with Learning Curves. An introduction to two fundamental concepts in machine learning through the lens of learning curves.
- When accuracy doesn't help. An introduction to precision, recall, and f1-score metrics to measure a machine learning model's performance.